Identify performance issues before they affect your customers
Continuous improvements
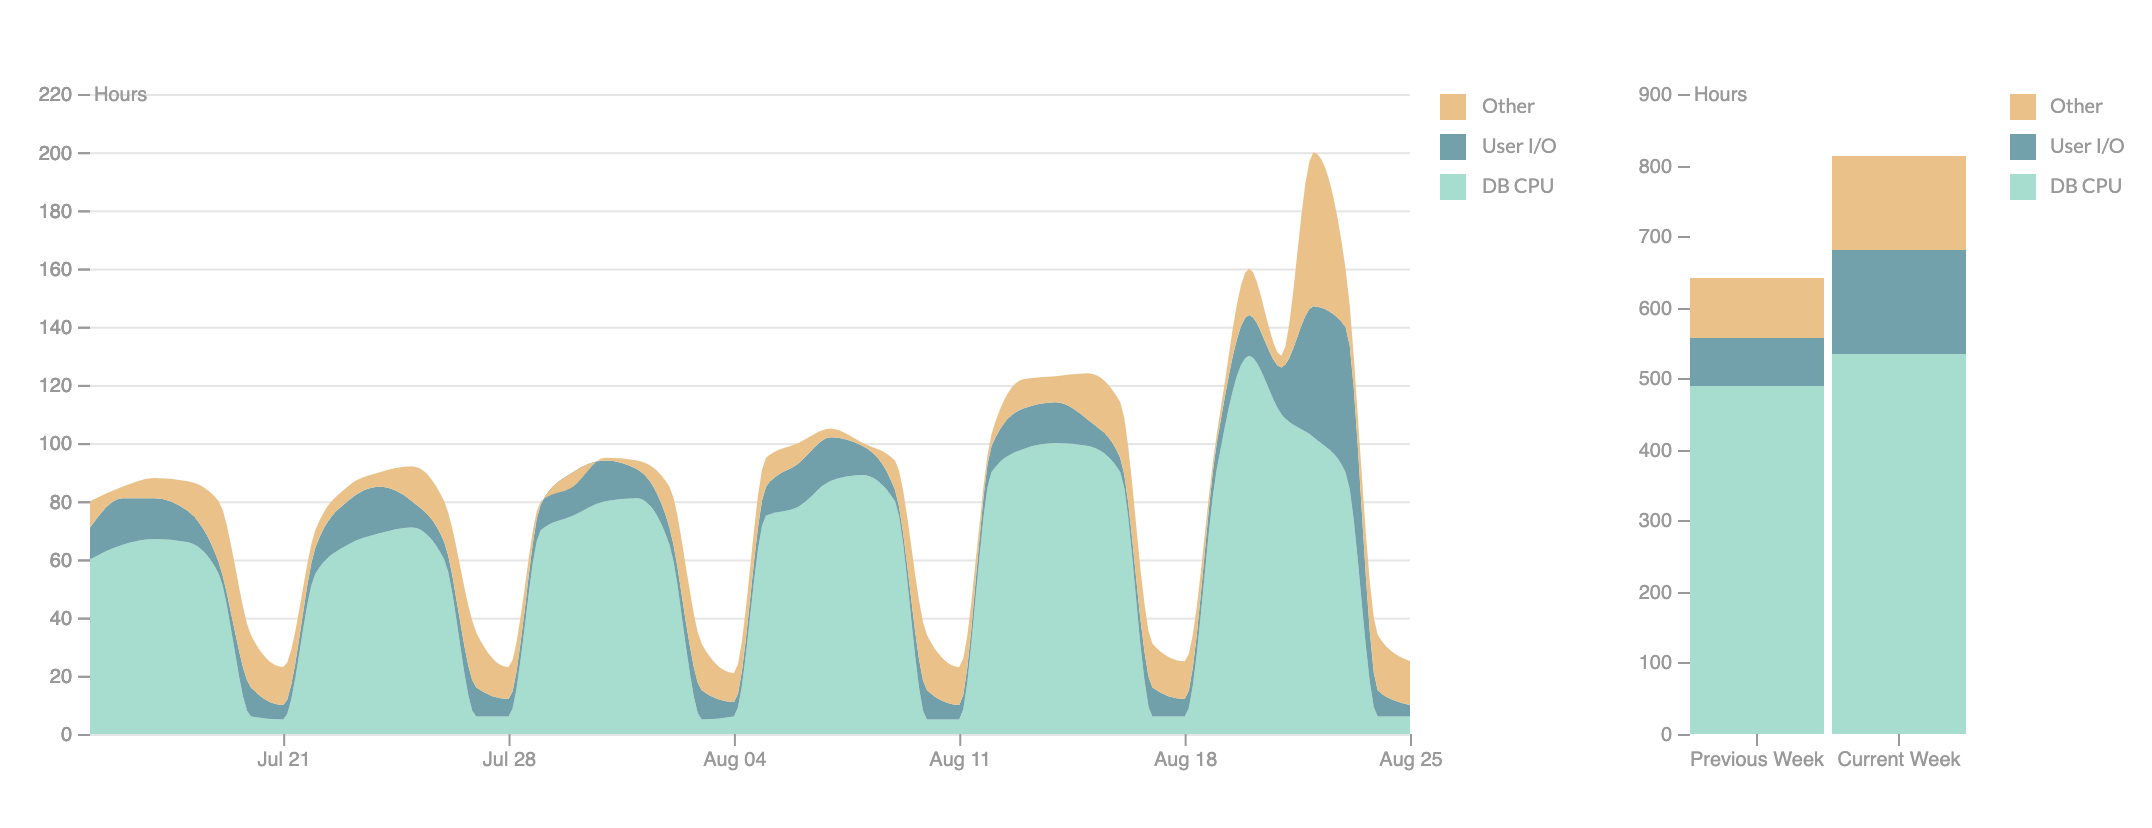
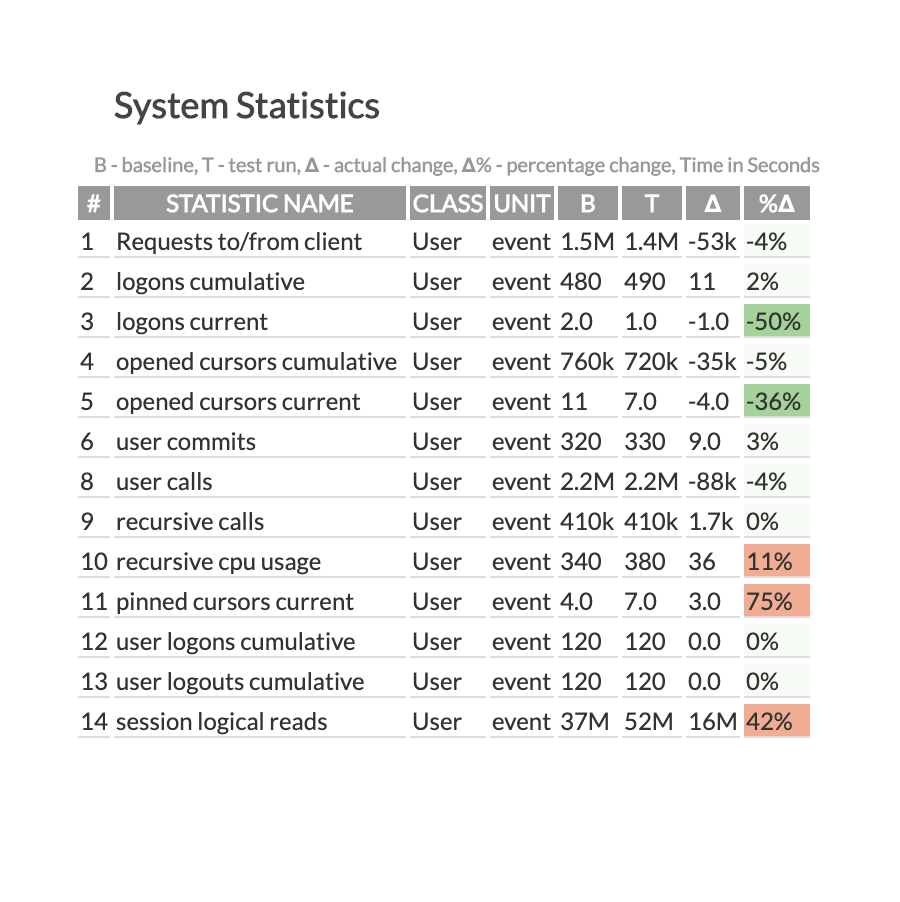
Compare database performance regularly in production and before every release. Identify changes in utilization patterns and application workload. Fix issues before they impact customers. Streamline the entire process with xdbtime.1. Compare
2. Analyze
3. Improve
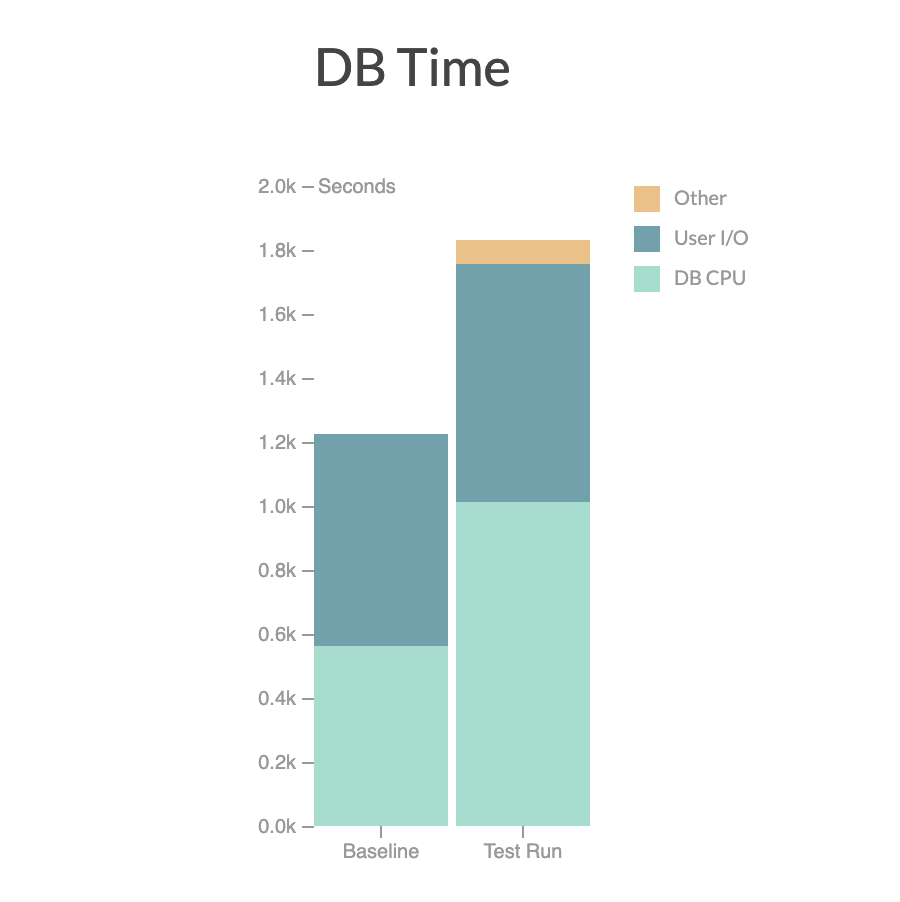
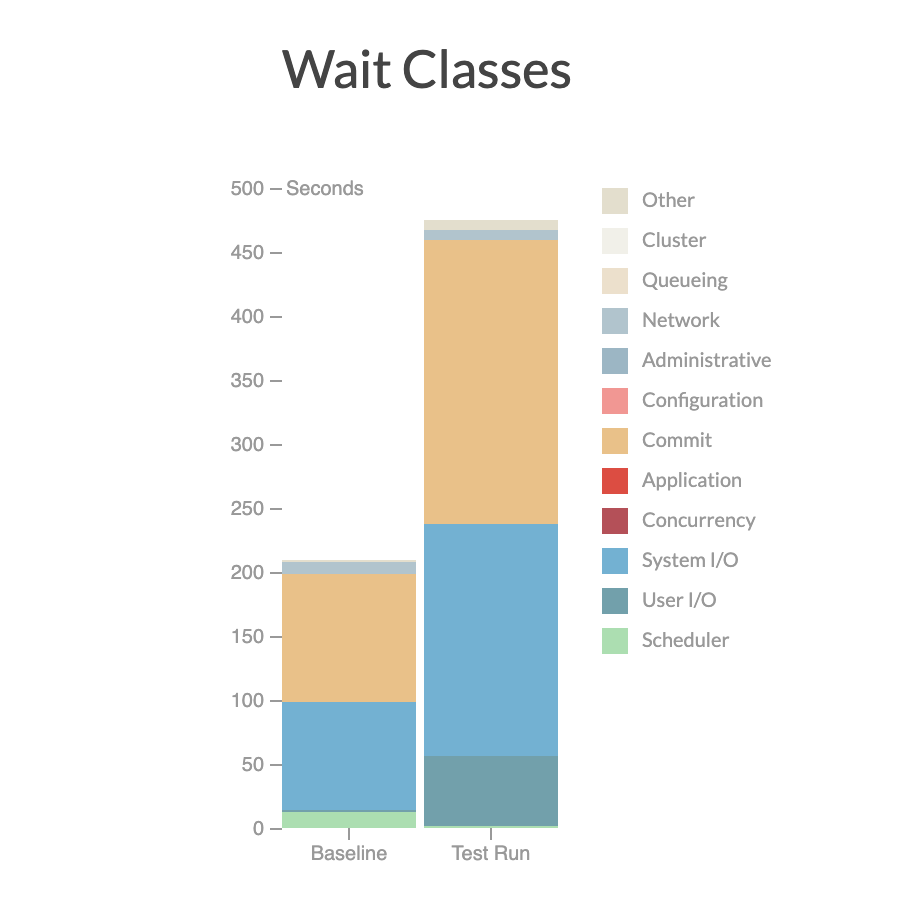
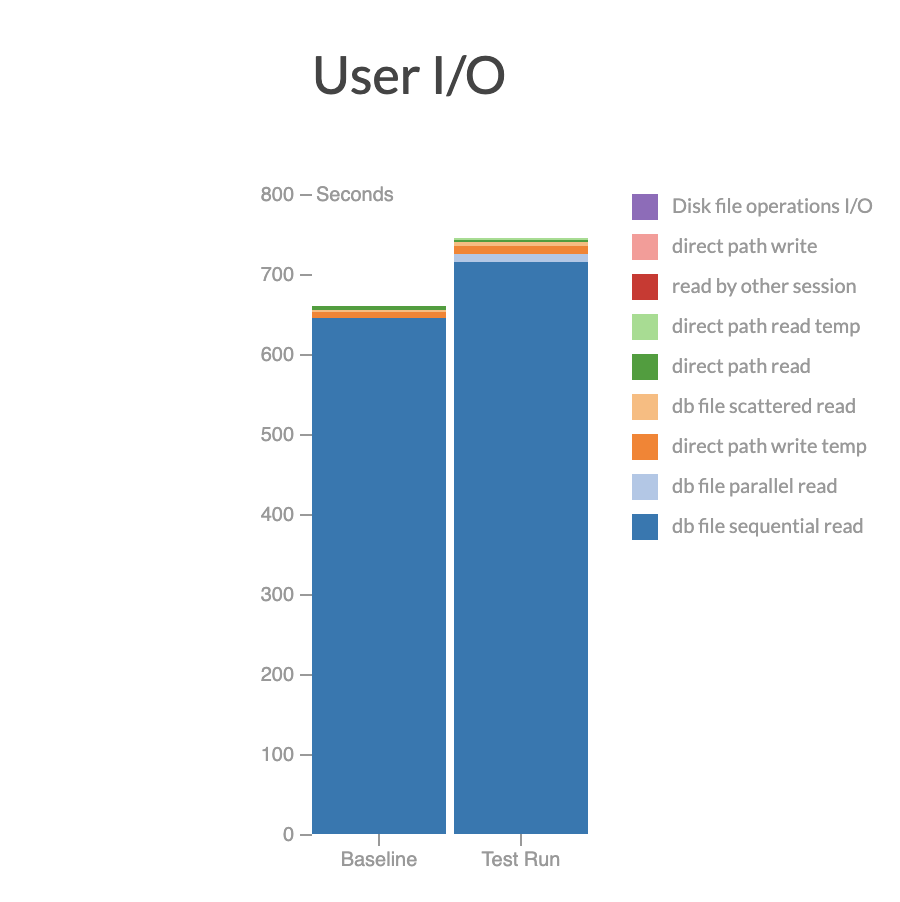
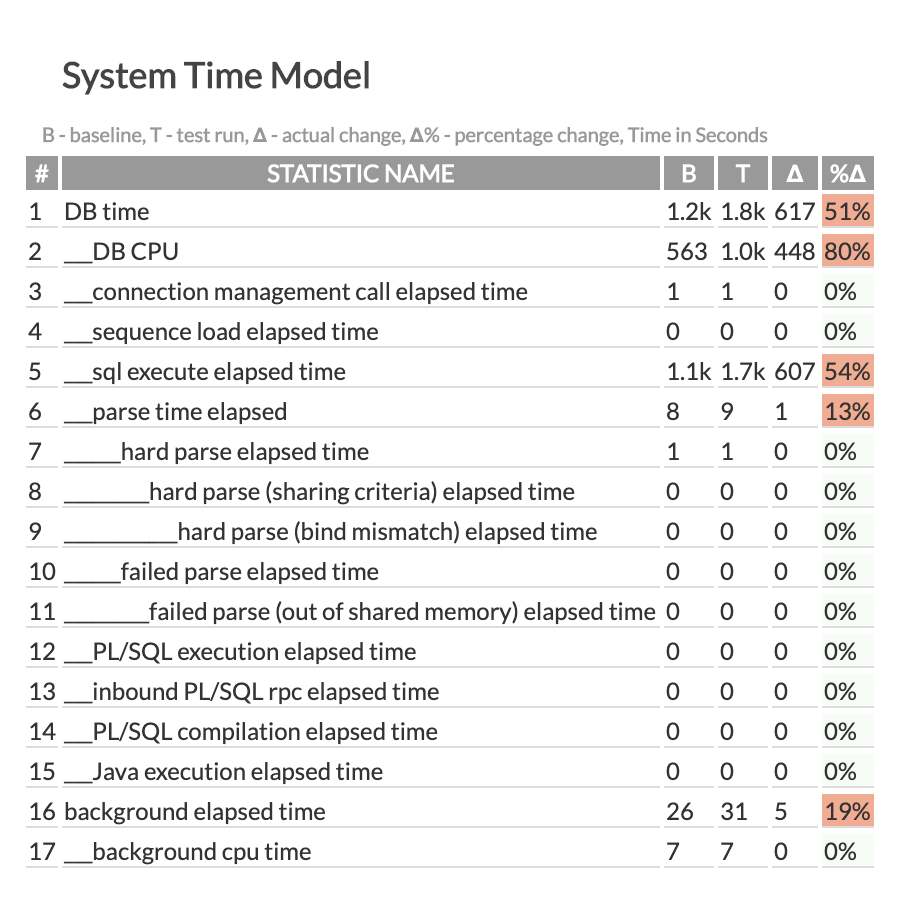
Explain Database Time
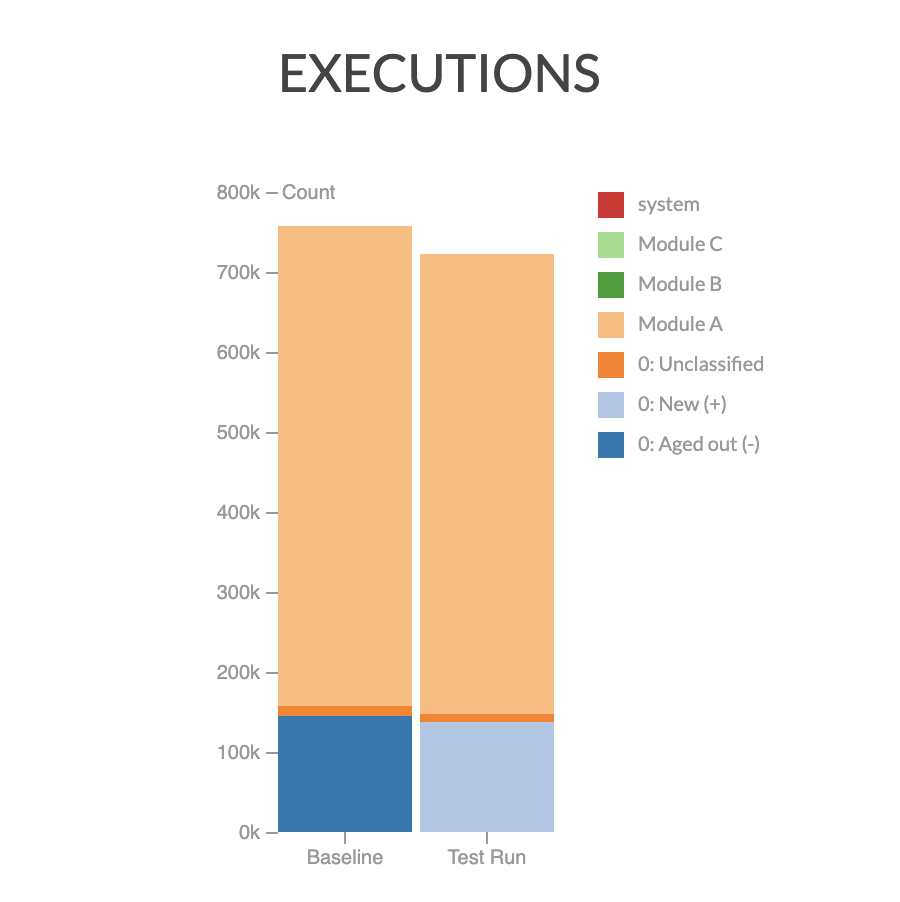
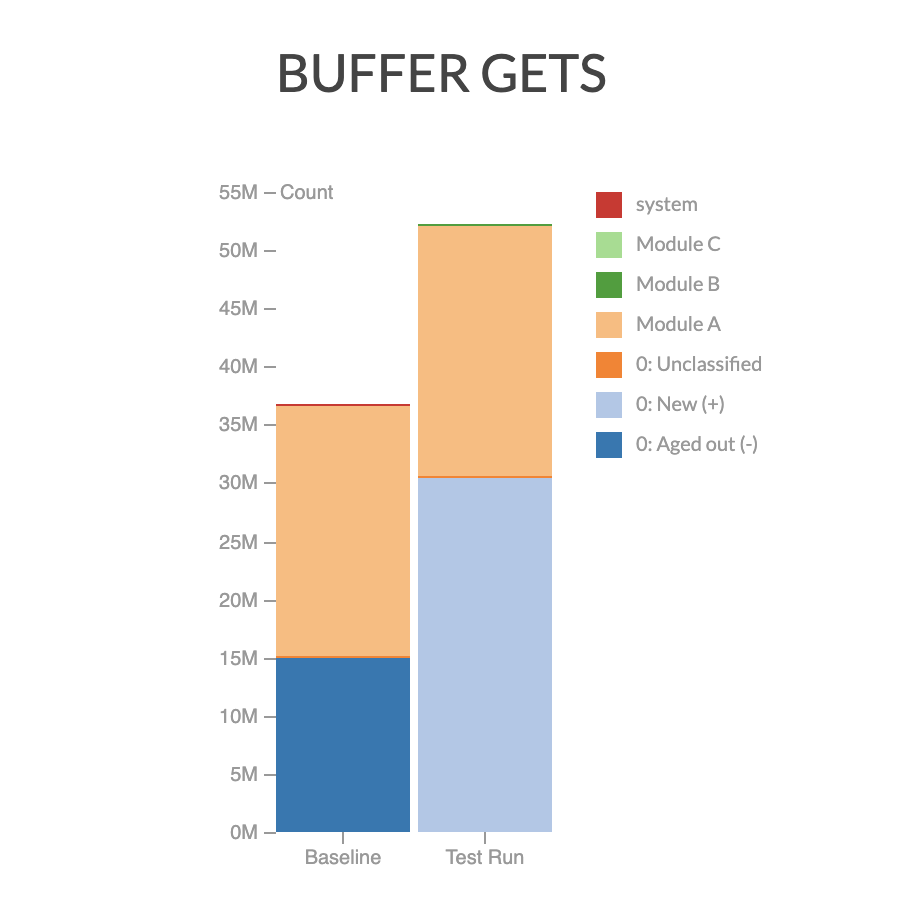
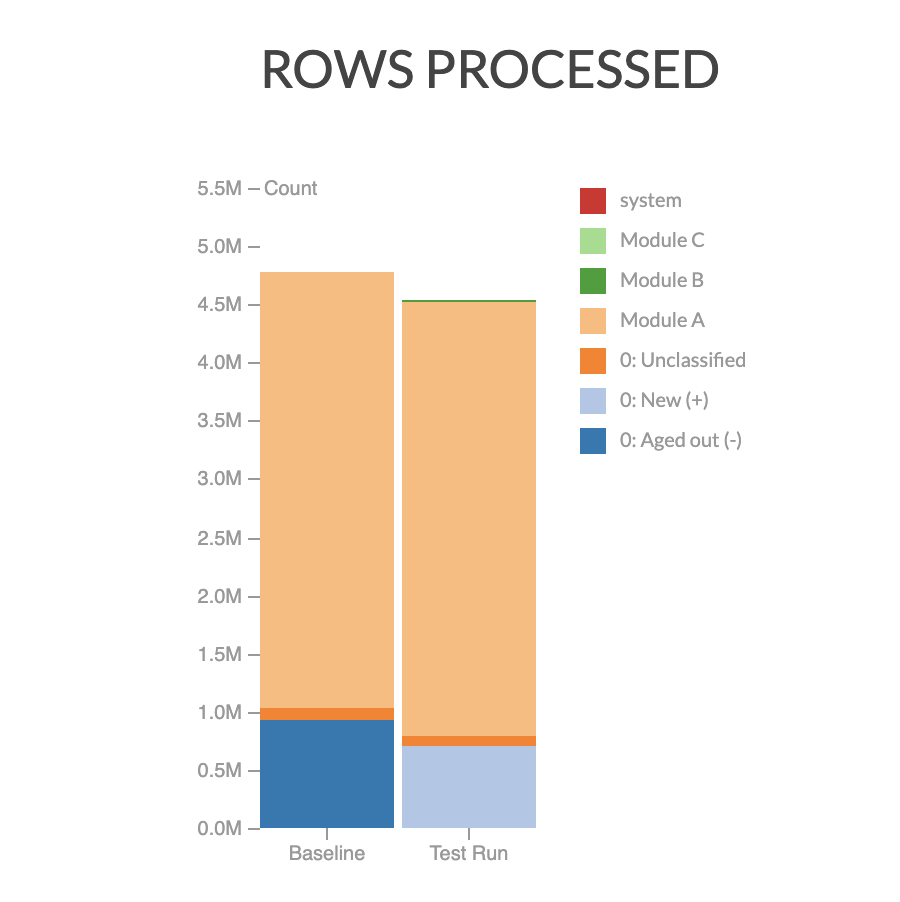
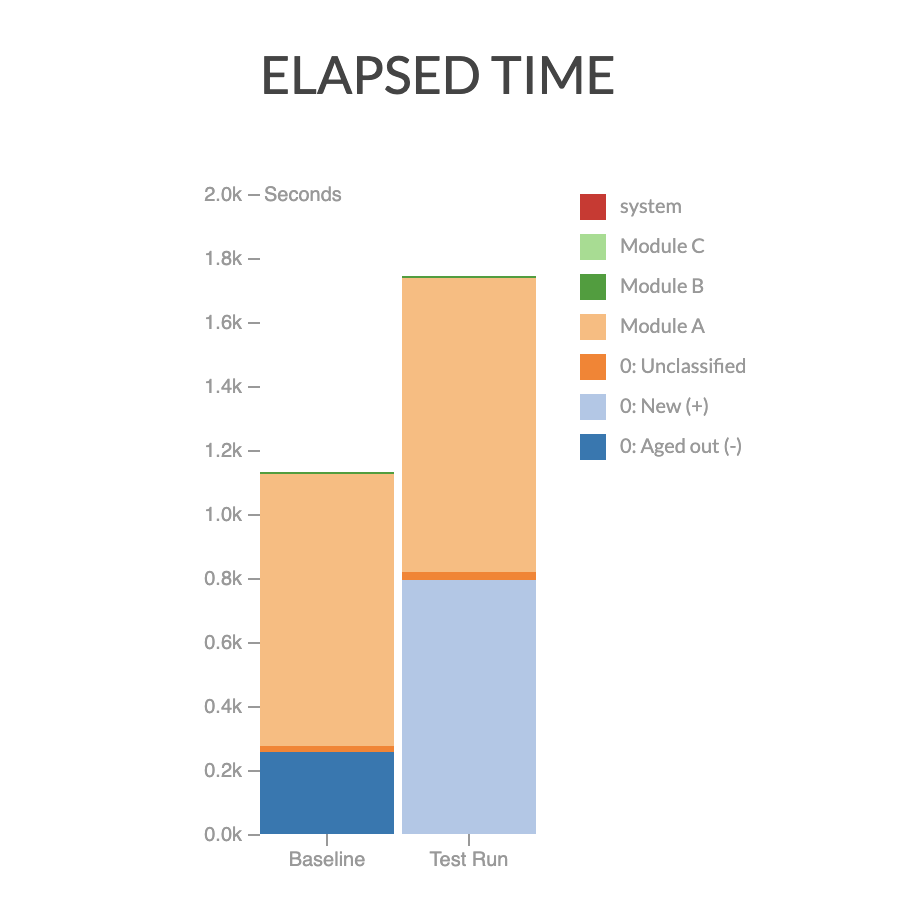
Xdbtime report
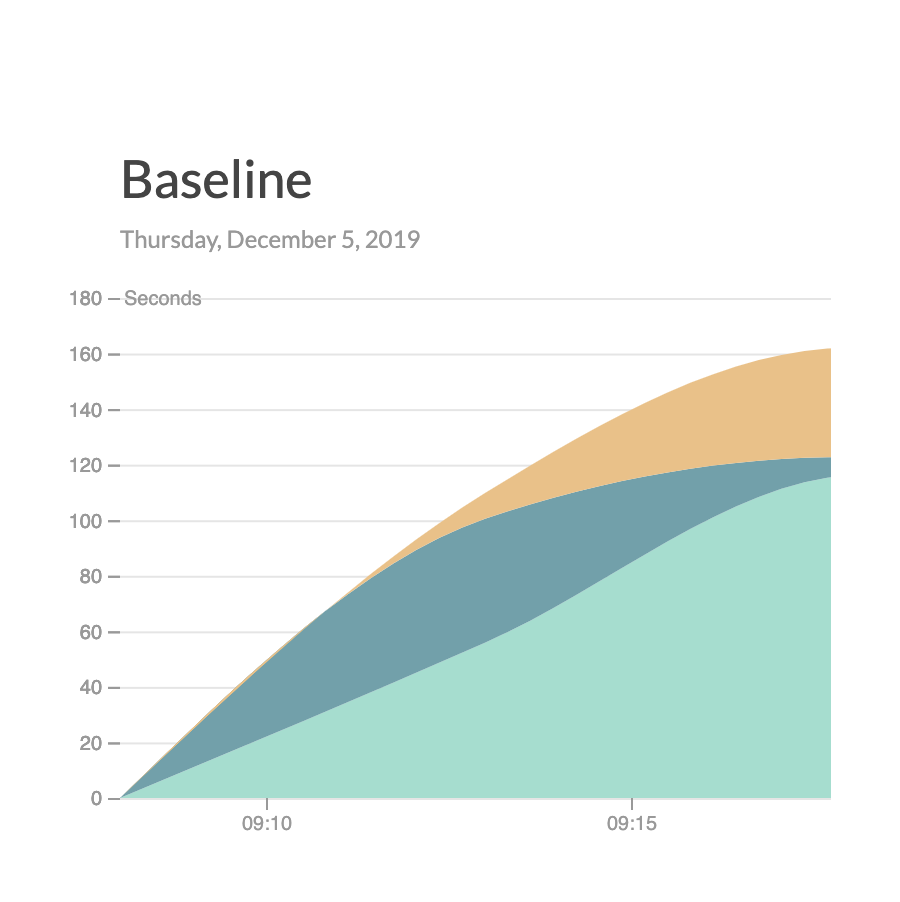
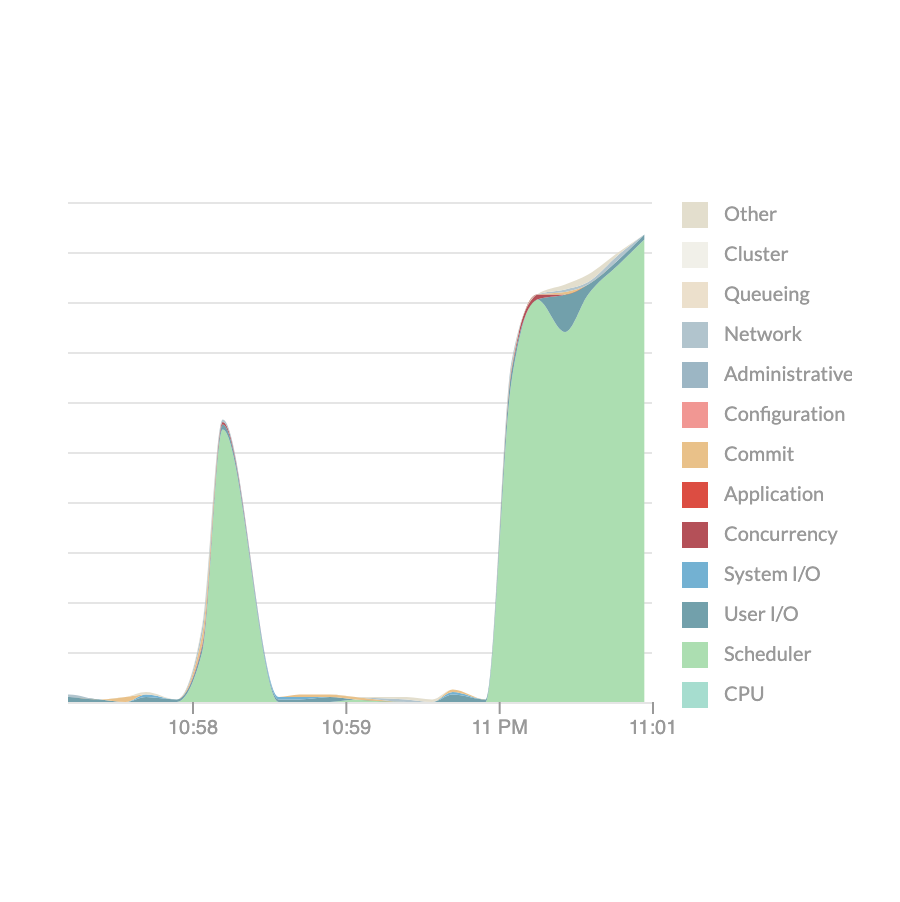
Visualization
From general to particular
All in one
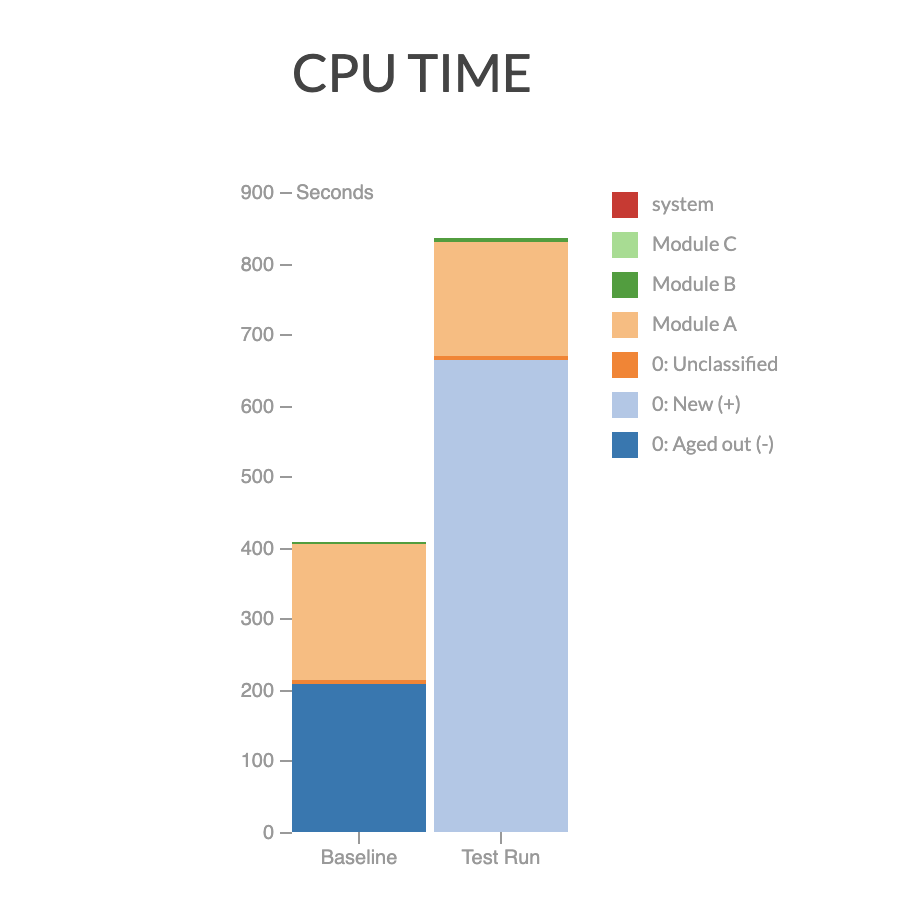
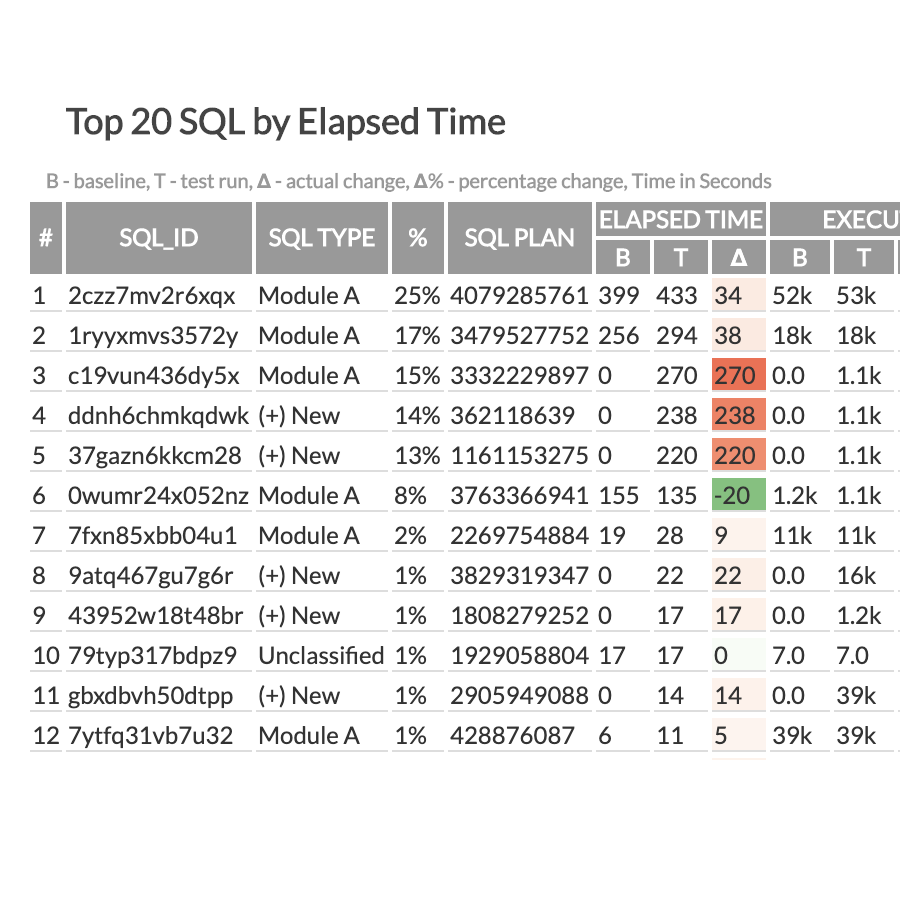
Classify SQLs
Highlight changes
Simple
Devops
Automation
Strategy
Databases
Download xdbtime
Checkout xdbtime project on GitHub ( or download ). Community edition includes period comparison report for Oracle, MySQL, and SQL Server databases.
xdbtime pro is designed for enterprises that need comprehensive performance management across complex database environments. Scale your performance analysis across multiple database instances and establish enterprise-wide performance standards. Our implementation experts help you build sustainable processes that transform database performance from reactive troubleshooting to strategic advantage. Contact us to discuss how xdbtime can accelerate your database optimization initiatives and prevent performance issues before they impact your business.